
This post is a bit more formal. It contains some definitions and graphs. Generally I try to avoid abstract language, but in this case I found formal explanation to be very suitable to carry my message across to you. I hope you will find it useful and inspiring too.
Start-ups and companies undergoing radical reforms at one point or another start thinking about their product portfolio. The most mind-boggling questions are; Which capabilities should I turn into products and offer to the market? How wide should the portfolio be? How will I satisfy my customers who want the impossible t.i. the best products (not just good!) for all their demands?
Since I was recently involved in similar processes several times, I have given a lot of thoughts to this matter. I found out some clues which, I hope, will help you design your product portfolio.
Let us start with some definitions. Say your company operates in some particular field of business. Let us denote this area with D - domain of your business. Domain D represents all the possible products you could provide for your customers. In other words, D represents all possible needs or problems your customers could have.
Your company, which operates in this business delivers products, which satisfy some of the customers' needs. Some needs are better addressed than others, but in general your offer for the market could be represented as a function of added value over your domain v(d). See example in Figure 1.
 Figure 1.
The curve in Figure 1 shows that you are covering approximately one third of customers' needs and that you are particularly good at solving problems near the peak of the curve. Let us denote the problem for which you provide the largest added value as D0. In other words D0 represents your company's competitive edge. See Figure 2.

Figure 2.
If provided value V0 is one of the largest in the market, then you are probably the market leader for product D0. But what if this is not the case? What if there is a competitor providing much better product than you are? Let us denote your competitor's added value for product D0 as VM and let us say that this is the current maximum value provided for the market. Therefore your competitor is also a market leader for the product D0. This situation is sketched in Figure 3.
 Figure 3.
As you can see in Figure 3, the value provided by your company is much smaller than the value provided by your competitor and market leader. To make things even worse, this is happening where your biggest strength should be - at the peak of the curve. Obviously, you need to "grow" the peak to match your competitor.
 Figure 4.
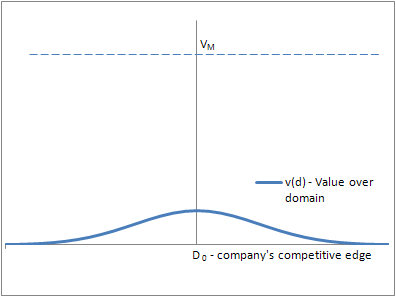 Figure 5.
 Figure 6.
Can you?
Yes, you can!
Here is how. The area under curve is your company's capacity, which is constant. The capacity, let us call it C, is limited by the resources of your company. These are people, knowledge, brands, capital, etc. See Figure 4.
Figure 4.Therefore, you can not expand the capacity, but you can modify the curve as you like as long as you preserve the area under curve. For example, you can decide to widen you product portfolio (Figure 5) or you can decide to shrink it (Figure 6).
Figure 5. Figure 6.Which one do you think will reach the customers? Offering lots of (under) average products or offering a small set of exceptional products?
My bet is the latter.
My bet is the latter.
I would go even further and I would not settle for "just good" products. Just good is not good enough. It is too risky. I would squeeze the value curve as much as needed so that the top would stick out of the current best offers. Today, in globally connected world, it is really hard and risky to offer "just good" products. The customers have lots of information and relatively easy access to any company in the world.
Now, let us say you specialize. You focus and dedicate your resources to the product you are the best at. Unless you are a giant multinational corporation, your value added curve looks similar to that in Figure 6.
When you visit some customers, you find out that they expect the best products, but at the same time they expect you to address a majority of their demands. Let us sketch their expectations with a value added curve. See Figure 7.
 Figure 7.
That might seem scary at first. Your company clearly cannot realize their expectations, since the capacity in Figure 7 greatly exceeds your realistic capacity. Compare Figure 6 and Figure 7. Area under curve in Figure 7 is much larger than that in Figure 6.
What now? Did we get it all wrong?
No.
It is time that you get partners t.i. companies which deliver the best products; products which you intentionally left out to be the market leader for D0. Look for companies, which are similar to you, which have a narrow added value curve and which curves do not overlap too much with your curve. This should not be hard now. Almost every company, which operates in a niche wants to cooperate with the best companies which help it complete its portfolio just like your company.
Imagine how impossible this would be, if you had a wide, flat added value curve. Like that drawn in figure 5. Do companies want a partnership with another company which offers (under) average products? Do they want a partnership with another company which offers competitive products besides a little bit of everything that it does? I guess not.
When you go looking for partners, make sure they are the best at what they do and that their product portfolio does not overlap too much with yours. Only this way your company and your partners can realize your customers' expectations. Figure 8 shows an example. See how this figure is getting closer to Figure 7, which shows customers' expectations.
 Figure 8.
Connect as much partners as needed to complete customers' vision, but be very conservative when thinking about delivering some new product far away from D0 yourself.
When you visit some customers, you find out that they expect the best products, but at the same time they expect you to address a majority of their demands. Let us sketch their expectations with a value added curve. See Figure 7.
Figure 7.That might seem scary at first. Your company clearly cannot realize their expectations, since the capacity in Figure 7 greatly exceeds your realistic capacity. Compare Figure 6 and Figure 7. Area under curve in Figure 7 is much larger than that in Figure 6.
What now? Did we get it all wrong?
No.
It is time that you get partners t.i. companies which deliver the best products; products which you intentionally left out to be the market leader for D0. Look for companies, which are similar to you, which have a narrow added value curve and which curves do not overlap too much with your curve. This should not be hard now. Almost every company, which operates in a niche wants to cooperate with the best companies which help it complete its portfolio just like your company.
Imagine how impossible this would be, if you had a wide, flat added value curve. Like that drawn in figure 5. Do companies want a partnership with another company which offers (under) average products? Do they want a partnership with another company which offers competitive products besides a little bit of everything that it does? I guess not.
When you go looking for partners, make sure they are the best at what they do and that their product portfolio does not overlap too much with yours. Only this way your company and your partners can realize your customers' expectations. Figure 8 shows an example. See how this figure is getting closer to Figure 7, which shows customers' expectations.
Figure 8.Connect as much partners as needed to complete customers' vision, but be very conservative when thinking about delivering some new product far away from D0 yourself.

No comments:
Post a Comment